Gradation Test
一、 Overview
The gradation and size test (Figure 1) is used to determine aggregate particle size distribution. Size distribution is perhaps the single most important aggregate quality associated with the control of HMA mixtures. Aggregate gradation and size affect HMA volumetric properties as well as mixture permeability and workability.
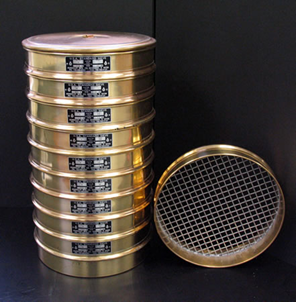 Figure 13: Stacked sieves used for a gradation and size test
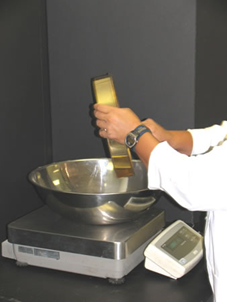 Figure 14: Weighing the aggregate retained on a sieve.
In a gradation and size analysis, a sample of dry aggregate of known weight is separated through a series of sieves with progressively smaller openings. Once separated, the weight of particles retained on each sieve is measured (Figure 2) and compared to the total sample weight. Particle size distribution is then expressed as a percent retained by weight on each sieve size. Results are usually expressed in tabular or graphical format. Graphical displays almost always use the standard 0.45 power gradation graph.
The standard gradation and sieve analysis test is:
- AASHTO T 27 and ASTM C 136: Sieve Analysis of Fine and Coarse Aggregates
二、 Background
The particle size distribution, or gradation, of the constituent aggregate (Figure 3) is one of the most influential characteristics in determining how an HMA mixture will perform as a pavement material. Aggregate gradation influences almost every important HMA property including stiffness, stability, durability, permeability, workability, fatigue resistance, skid resistance and resistance to moisture damage (Roberts et al., 1996[1]).
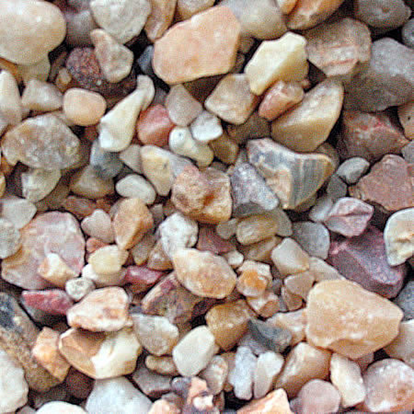 Figure 15: Aggregate up close.
Gradation Graphs
Gradation is often expressed in graphical form. Typically gradation graphs use concepts of maximum density gradation and its expression in equation form to plot a special graph referred to as the FHWA 0.45 power graph.
Maximum Density Gradation
Theoretically, there exists a particular gradation that, for a given maximum aggregate size, will produce the maximum density. This gradation would involve a particle arrangement where successively smaller particles are packed within the voids between larger particles (Figure 4). If done ideally, this would result in a minimum void space between particles and produce a maximum density. Practically, an aggregate gradation of maximum density is not desired because a certain amount of void space is required to provide adequate volume for the asphalt binder to occupy.
Fuller and Thompson’s Equation (Interactive Equation)
Regardless of its practical use, a maximum density gradation provides a convenient reference. In 1907, Fuller and Thompson developed a widely used equation to describe a maximum density gradation for a given maximum aggregate size. This equation is:
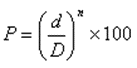
Where:
- P = percent finer than an aggregate size
- d = aggregate size being considered
- D = maximum aggregate size
- n = parameter which adjusts curve for fineness or coarseness (for maximum particle density n ≈ 0.5 according to Fuller and Thompson)
The 0.45 Power Maximum Density Graph (see Graph)
In the early 1960s, the FHWA introduced the standard gradation graph used in the HMA industry today. This graph uses Fuller and Thompson’s equation with n = 0.45 and is convenient for determining the maximum density line and adjusting gradation (Roberts et al., 1996[1]). This graph is slightly different than other gradation graphs because it uses the sieve size raised to the nth power (usually 0.45) as the x-axis units. Thus, a plot of Fuller and Thompson’s maximum density equation with n = 0.45 appears as a straight diagonal line. This straight line goes from zero to the maximum aggregate size for the gradation being considered. There is some debate as to whether this line should end at maximum aggregate size or nominal maximum aggregate size or somewhere in between, however the most commonly accepted practice is to end it at the maximum aggregate size.
Gradation Types (see Graph)
Aggregate gradation can be generally described by a few broadly defined gradation categories; each one describing a general type of gradation. These categories are:
- Dense or well-graded. Refers to a gradation that is near the FHWA’s 0.45 power curve for maximum density. The most common HMA mix designs in the U.S. tend to use dense graded aggregate. Typical gradations are near the 0.45 power curve but not right on it. Generally, a true maximum density gradation (exactly on the 0.45 power curve) would result in unacceptably low VMA.
- Gap graded. Refers to a gradation that contains only a small percentage of aggregate particles in the mid-size range. The curve is flat in the mid-size range. Gap graded mixes can be prone to segregation during placement. Stone matrix asphalt (SMA) is a gap graded HMA.
- Open graded. Refers to a gradation that contains only a small percentage of aggregate particles in the small range. This results in more air voids because there are not enough small particles to fill in the voids between the larger particles. The curve is near vertical in the mid-size range, and flat and near-zero in the small-size range.
- Uniformly graded. Refers to a gradation that contains most of the particles in a very narrow size range. In essence, all the particles are the same size. The curve is steep and only occupies the narrow size range specified.
The desired gradation for a particular HMA mixture is dependent upon its intended use and desired characteristics, predicted loading, environmental conditions, as well as material, structural and mix properties. Therefore, gradation requirements for specific HMA mixtures can vary widely. The vast majority of the HMA placed in the U.S. is dense-graded.
Maximum Aggregate Size
Maximum aggregate size can affect HMA in several ways. Instability (rutting, shoving) may result from excessively small maximum sizes; and poor workability and/or segregation may result from excessively large maximum sizes (Roberts et al., 1996[1]). Maximum aggregate size can be defined in two different ways:
- Maximum aggregate size. The smallest sieve through which 100 percent of the aggregate sample particles pass. Superpave mix design defines the maximum aggregate size as “one sieve larger than the nominal maximum size” (Roberts et al., 1996[1]).
- Nominal maximum aggregate size (NMAS). The largest sieve that retains some of the aggregate particles but generally not more than 10 percent by weight. Superpave mix design defines nominal maximum aggregate size as “one sieve size larger than the first sieve to retain more than 10 percent of the material” (Roberts et al., 1996[1]).
These two definitions will likely give different sizes for the same aggregate sample. Therefore, it is important to specify whether “maximum size” or “nominal maximum size” is being referenced.
Other Gradation Terms (see Graph)
- Fine gradation. A gradation that, when plotted on the 0.45 power gradation graph, falls mostly above the 0.45 power maximum density line. The term generally applies to dense graded aggregate.
- Coarse gradation. A gradation that, when plotted on the 0.45 power gradation graph, falls mostly below the 0.45 power maximum density line. The term generally applies to dense graded aggregate.
- Fine aggregate (sometimes just referred to as “fines”). Defined by the Asphalt Institute (2001[2]) as the fraction of aggregate passing the 2.36 mm (No. 8) sieve. Defined by AASHTO M 147 as natural or crushed sand passing the No. 10 (2.00 mm) sieve and mineral particles passing the No. 200 (0.075 mm) sieve.
- Coarse aggregate. Defined by the Asphalt Institute (2001[2]) as the fraction of aggregate retained on the No. 8 (2.36 mm) sieve. Defined by AASHTO M 147 as hard, durable particles or fragments of stone, gravel or slag retained on the No. 10 (2.00 mm) sieve.
- Mineral filler. Defined by the Asphalt Institute (2001[2]) as the fraction of fine aggregate the passes the No. 30 (0.60 mm) sieve. This is not universally accepted; some organizations define “mineral filler” as passing the No. 200 (0.075 mm) sieve (this is actually the definition for “mineral dust” in the VSL). Pulverized limestone is the most commonly manufactured mineral filler, although other stone dust, silica, hydrated lime, portland cement and certain natural deposits of finely divided mineral matter are also used (Asphalt Institute, 1962).
- Mineral dust. Defined by the Asphalt Institute (2001[2]) as the fraction of fine aggregate that passes the No. 200 (0.075 mm) sieve.
- Restricted zone. A term associated with Superpave mix design that referred to a defined zone on the FHWA’s 0.45 power gradation graph. Originally, it was observed that mixes closely following the 0.45 power maximum density line in the finer gradations sometimes had unacceptably low VMA typically due to an excess of natural sand. Therefore, in an attempt to minimize this problem, Superpave mix design included a restricted zone through which a typical gradation should not pass as a recommended guideline. However, since the restricted zone’s original inception, NCHRP Report 464: The Restricted Zone in the Superpave Aggregate Gradation Specification has concluded that “…gradations that violated the restricted zone performed similarly to or better than the mixes having gradations passing outside the restricted zone; therefore, the restricted zone requirement is redundant for mixes meeting all Superpave volumetric parameters…It has been recommended to delete references to the restricted zone as either a requirement or a guideline from the AASHTO specification (AASHTO M 323) and practice (AASHTO R 35) for Superpave mix design.” (Kandhal and Cooley, 2001[3]). The restricted zone remains in Superpave as “guidance” only.
Gradation Specification
Gradation and size are specified by designating a NMAS and a series of gradation control points. Control points give the allowable percent passing (or retained) range for given sieve sizes. For instance, the gradation control points for a 0.5 inch (12.5 mm) Superpave mix specify a maximum of 58% passing and a minimum of 28% passing on the No. 8 (2.36 mm) sieve. The Control Points Graph shows aggregate gradation control points (shown as large dots) for Superpave mixes. These gradation control points are quite broad and were included for specific purposes (Huber, 1996[4]):
- 1st control point (minimum 100% passing). Defines the maximum aggregate size for a mix. By definition, 100% must pass this sieve size.
- 2nd control point set (90 to 100% passing). Defines the NMAS for a mix. By definition, 90 to 100% must pass this sieve size.
- 3rd control point set (No. 8 (2.36 mm) sieve). Used to control the amount of sand sized particles in the mixture. The upper control point excludes overly fine mixtures, while the lower control point ensures enough sand sized particles are included to make a dense graded mixture.
- 4th control point set (No. 200 (0.075 mm) sieve). Obtained from ASTM D 3515 as typical for dense graded mixtures. This excludes non-dense graded mixtures such as stone matrix asphalt (SMA), which typically has 10 to 14% passing the No. 200 (0.075 mm) sieve.
三、 Test Description
The following description is a brief summary of the test. It is not a complete procedure and should not be used to perform the test. The complete test procedure can be found in:
- AASHTO T 27 or ASTM C 136: Sieve Analysis of Fine and Coarse Aggregates
- AASHTO T 11 or ASTM C 117: Materials Finer than 75-µm (No. 200) Sieve in Mineral Aggregates by Washing
AASHTO T 30, Mechanical Analysis of Extracted Aggregate, is used when performing gradation analysis on aggregates extracted from an HMA mixture.
Summary
The test can be run on either dry or washed aggregate. The washed sieve analysis takes longer but produces a more accurate gradation, particularly the percent passing the No. 200 (0.075 mm) sieve since the washing helps remove these small particles from the larger particles. The dry sieve analysis procedure is often used where rapid results are required.
The basic sieve analysis consists of weighing an aggregate sample and then passing it through a nest of sieves. The nest of sieves is made up of a stack of wire-cloth screens with progressively smaller openings from top to bottom. The material retained on each sieve (Slideshow 1) is weighed and compared to the total sample mass. Particle size distribution is expressed as a percent retained or percent passing by weight on each sieve size. Figure 16 shows the major gradation and size analysis equipment.
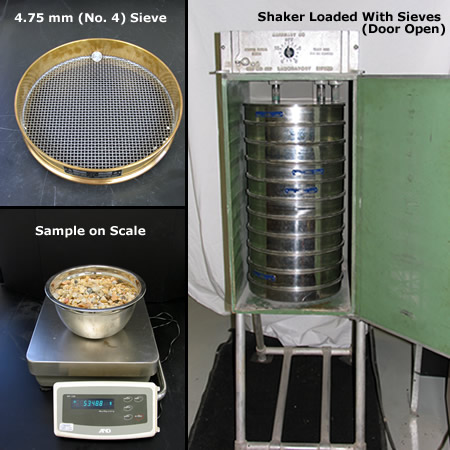 Figure 16 : Gradation and size equipment.
Approximate Test Time
The washed procedure takes one to three days from sampling the aggregate to completion depending on the moisture content of the aggregate when it is sampled.
The dry procedure can take about one to two hours from sampling the aggregate to completion.
Basic Procedure
- 1. Obtain an aggregate sample of adequate mass from one of the following locations: aggregate stockpiles, bins, dump trucks, conveyor belt, or the roadway.
- 2. Mix and reduce the sample (Figure 17) to an amount suitable for testing. This process of reducing a sample size is often referred to as “splitting” the sample (Video 1).
- 3. Dry the test sample to a constant mass and determine the sample’s dry mass./li>
Samples may be dried by heating (e.g., a hotplate) provided (AASHTO, 2000b[5]): 1. Steam is allowed to escape without generating pressures great enough to fracture the aggregate particles. 2. Temperature is not great enough to cause chemical breakdown of the aggregate.
Generally, it is not necessary to dry the coarse aggregate since results are not significantly influenced by its moisture content. Coarse aggregate should be dried if: The NMAS is < 0.5 inches (12.5 mm), or it contains appreciable material finer than No. 4 (4.75 mm) sieve, or it is highly absorptive.
- If using the washed procedure, place the dry sample in a container and cover with water. Agitate the sample to completely separate all particles finer than the No. 200 (0.075 mm) sieve from the coarser aggregate, and to bring the fine material into suspension. Immediately decant the wash water containing the suspended solids over a nest of sieves consisting of a No. 200 (0.075 mm) sieve and an upper sieve with openings in the range of No. 8 (2.36 mm) to No. 16 (1.18 mm).
- 5. If using the washed procedure, repeat step 4 until the wash water is clear.
- 6. If using the washed procedure, return the material retained on the nested sieves to the washed sample by flushing with water. Dry the washed sample to a constant mass and allow to cool. Determine mass of the sample after washing.
- 7. Select applicable sieves to obtain the information required by the specifications covering the material to be tested. Sieve sizes typically used for Superpave mix design are 1½ in, 1.0 in, ¾ in, ½ in, 3/8 in, No. 4, No. 8, No. 16, No. 30, No. 50, No. 100 and No. 200 (37.5, 25.0, 19.0, 12.5, 9.5, 4.75, 2.36, 1.18, 0.600, 0.300, 0.150 and 0.075 mm) sieves. Assemble the sieves in order of decreasing size of opening from top to bottom and place the nest of sieves over a pan (Video 3).
- 8. Pour the sample into the top sieve in the nest (Figure 8).
- 9. Sieve the material in a mechanical sieve shaker (Figure 20 and Video 4).
- 10. Determine the mass of the material retained on each sieve size (Video 5). Record the cumulative mass retained for each sieve size (the mass retained on a specific sieve size and the mass retained on all sieves with larger openings).
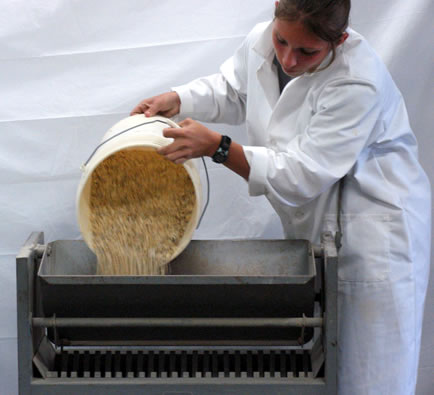 Figure 17 : Splitting a large aggregate sample.
Automated washers (Figure 18 and Video 2) are available, which may aid in the washing process.
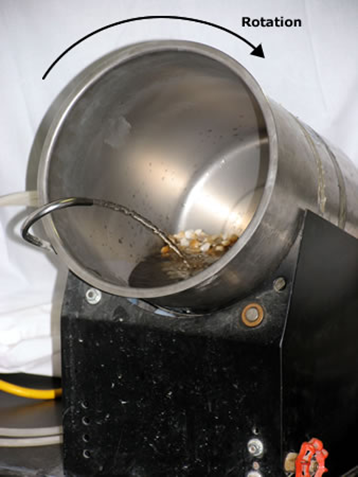 Figure 17 : Splitting a large aggregate sample.
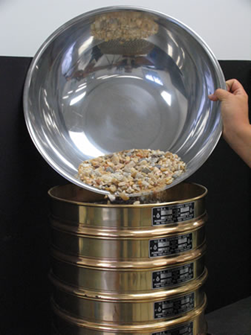 Figure 19: Pouring the aggregate sample into the sieve stack
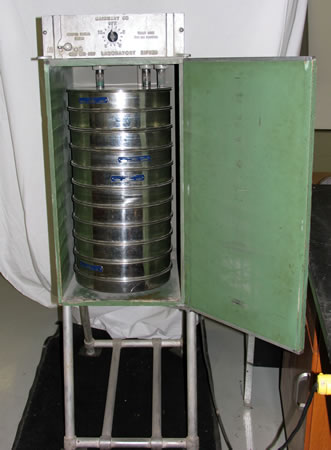 Figure 20: Shaker for use in a gradation
Be careful that the sample does not overcharge any individual sieves. Excess material on a particular sieve may prevent may block material that would otherwise pass through the sieve.
四、 Results
Parameters Measured
Percent retained or percent passing each sieve size by mass and material finer than the 0.075 (No. 200) sieve.
Specifications
Superpave mix design specifies aggregate gradation control points for mixes of NMAS 0.375 inch (9.5 mm), 0.5 inch (12.5 mm), 0.75 inch (19.0 mm), 1.0 inch (25.0 mm) and 1.5 inch (37.5 mm). Figure 10 shows just one of these sizes in a pile at a fully fractionated aggregate quarry.
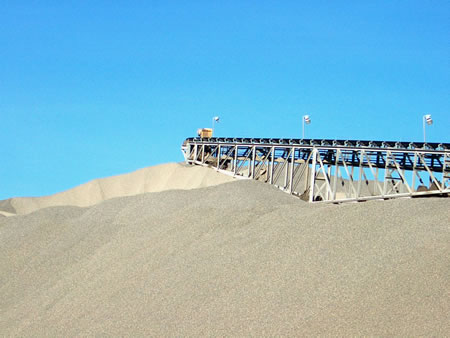 Figure 21: Aggregate after processing from a quarry.
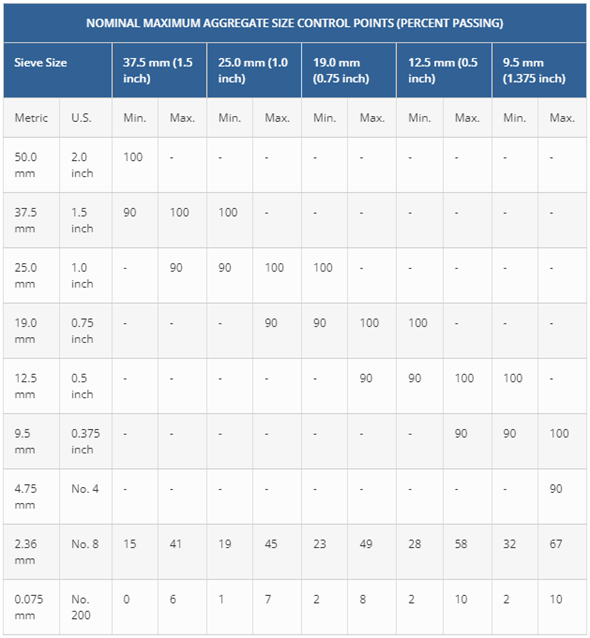
The following table (from AASHTO M 323) shows the gradation control points used by the Superpave mix design process. Sometimes, local agencies modify these control points to suit local need.
Superpave Mix Design Aggregate Gradation Control Points(from AASHTO M 323)
The following figure shows the gradation control points from the previous table in interactive graphical form.
Typical Values
There is no standard gradation and size for Superpave mix design. Generally, gradation and size will meet gradation control points defined in the Superpave mix design specification (AASHTO M 323). However, many state and local agencies specify their own gradation control points, which can differ from standard Superpave gradation control points.
Although gradation and size will vary by a HMA’s intended use, location and material availability, a majority of Superpave HMA mixes are 0.5 inch (12.5 mm) or 0.75 inch (19.0 mm) NMAS dense graded mixtures.
Pavement designed for heavy loading such as airports (Figure 22), industrial facilities (Figure 23) and port facilities (Figure 24) will often use a larger NMAS (usually ≥ 0.75 inch (19.0 mm)). These pavements require special care in order to be designed and constructed correctly.
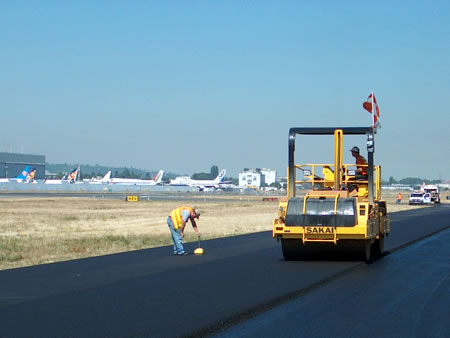 Figure 22: Port pavement use.
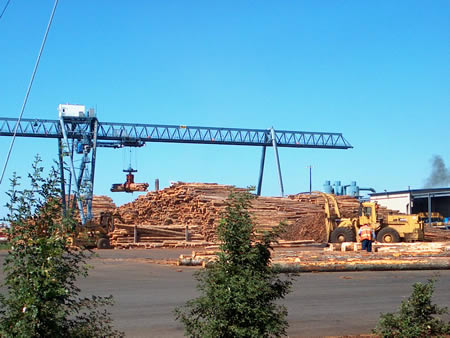 Figure 23: Industrial pavement use.
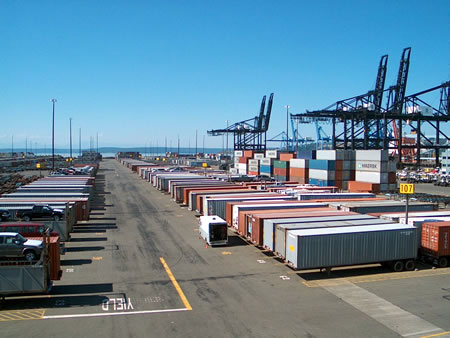 Figure 24: Port pavement use.
A HMA base layer is sometimes constructed with larger NMAS; usually ≥ 19.0 mm (0.75 inch).
Calculations
Gradation may be reported as either a percentage retained or percentage passing each sieve size.
Percentage Retained on Each Sieve
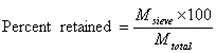
Where:
- Msieve = cumulative mass retained on a sieve
- Mtotal = total original sample mass
Percentage Passing Each Sieve
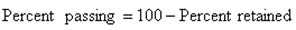
Report percentages to the nearest whole number, except for the percentage passing the No. 200 (0.075 mm) sieve which is reported to the nearest 0.1 %.
Footnotes
- 1. Roberts, F.L.; Kandhal, P.S.; Brown, E.R.; Lee, D.Y. and Kennedy, T.W. (1996). Hot Mix Asphalt Materials, Mixture Design, and Construction. National Asphalt Pavement Association Education Foundation. Lanham, MD.↵
- 2. Asphalt Institute. (2001). HMA Construction. Manual Series No. 22 (MS-22). Asphalt Institute. Lexington, KY.↵
- 3. Kandhal, P.S. and Cooley, L.A. (2001). NCHRP Report 464: The Restricted Zone in the Superpave Aggregate Gradation Specification. Transportation Research Board, National Research Council. Washington, D.C. http://onlinepubs.trb.org/onlinepubs/nchrp/nchrp_rpt_464-a.pdf.↵
- 4. Huber, G. (1996). Superpave Evaluation of Gradation. Superpave Asphalt Research Program, University of Texas, Austin. http://www.utexas.edu/research/superpave/articles/sp_grad1.html. Accessed 28 Aug 2004.↵
- 5. American Association of State Highway and Transportation Officials (AASHTO). (2000b). Standard Specifications for Transportation Materials and Methods of Sampling and Testing, Twentieth Edition: Part II – Tests. American Association of State Highway and Transportation Officials. Washington, D.C.↵